W. Stephen Tait, Ph.D.
Chief Science Officer & Principal Consultant,
Pair O Docs Professionals, LLC
Corrosion Corner
Statistical analysis
for spray package tests
Hello, everyone. In many instances, spray packages are
qualified for commercial markets with a variety of tests,
such consumer preference and corrosion tests.
The statistical average (statistical mean) for each data-group is
often used to compare the results between different groups of test
variables. However, statistical means hide extreme values that are
important for decisions on commercializing new products and
line extensions. Not paying attention to extreme values in corrosion
data could lead to unexpected package failures.
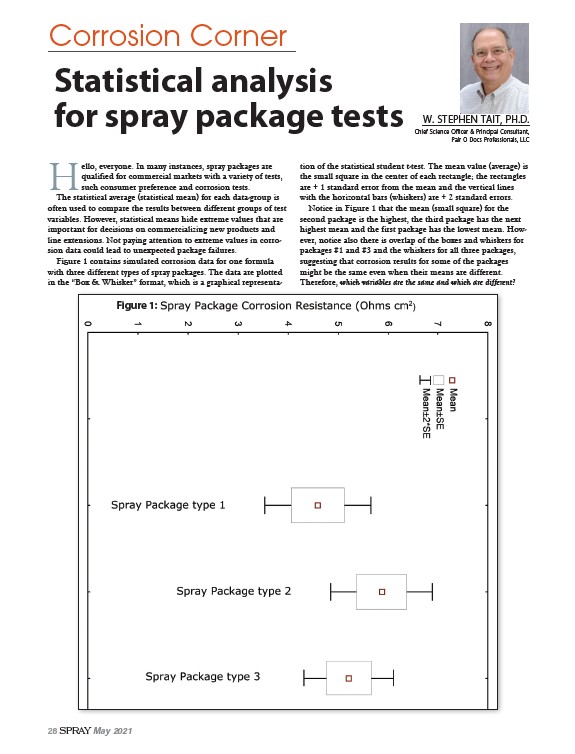
Figure 1 contains simulated corrosion data for one formula
with three different types of spray packages. The data are plotted
in the “Box & Whisker” format, which is a graphical representation
of the statistical student t-test. The mean value (average) is
the small square in the center of each rectangle; the rectangles
are + 1 standard error from the mean and the vertical lines
with the horizontal bars (whiskers) are + 2 standard errors.
Notice in Figure 1 that the mean (small square) for the
second package is the highest, the third package has the next
highest mean and the first package has the lowest mean. However,
notice also there is overlap of the boxes and whiskers for
packages #1 and #3 and the whiskers for all three packages,
suggesting that corrosion results for some of the packages
might be the same even when their means are different.
Therefore, which variables are the same and which are different?
Figure 1:
28 Spray May 2021