Japanese aerosol fillings
decrease slightly in 2016
According to the Aerosol Industry Association
of Japan (AIAJ), the estimated number of
units filled in 2016 (January to December) is
517,621,000, a decrease of 1.3% from 2015, which saw
524,536,000 aerosol products filled.
Personal Care products had the lion’s share of fillings
in 2016, with almost 259 million units; Hair Spray and
Other Hair Care made up over 159 million of that
number. Other Hair Care saw the biggest leap of any
sub-category at 5.1%.
Insect Sprays were the second largest category at
almost 76.3 million, with Household Products a close
third at 71.9 million units.
While most categories declined in 2016, Coatings
& Finishes saw an increase (0.3%), as did Industrial
Products (0.7%). Spray
Coatings, Industrial, Hair Care see gains…
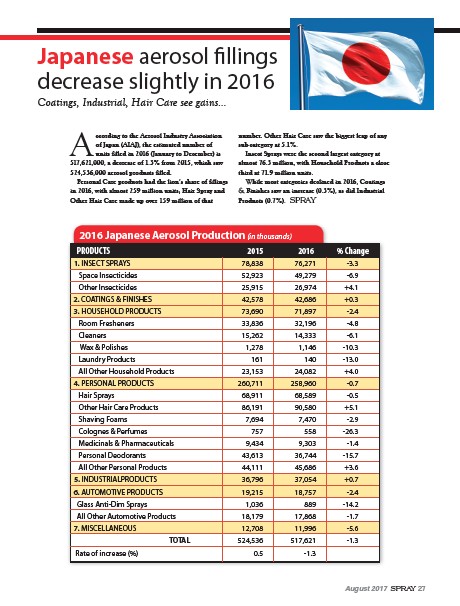
2016 Japanese Aerosol Production (in thousands)
PRODUCTS 2015 2016 % Change
1. INSECT SPRAYS 78,838 76,271 -3.3
Space Insecticides 52,923 49,279 -6.9
Other Insecticides 25,915 26,974 +4.1
2. COATINGS & FINISHES 42,578 42,686 +0.3
3. HOUSEHOLD PRODUCTS 73,690 71,897 -2.4
Room Fresheners 33,836 32,196 -4.8
Cleaners 15,262 14,333 -6.1
Wax & Polishes 1,278 1,146 -10.3
Laundry Products 161 140 -13.0
All Other Household Products 23,153 24,082 +4.0
4. PERSONAL PRODUCTS 260,711 258,960 -0.7
Hair Sprays 68,911 68,589 -0.5
Other Hair Care Products 86,191 90,580 +5.1
Shaving Foams 7,694 7,470 -2.9
Colognes & Perfumes 757 558 -26.3
Medicinals & Pharmaceuticals 9,434 9,303 -1.4
Personal Deodorants 43,613 36,744 -15.7
All Other Personal Products 44,111 45,686 +3.6
5. INDUSTRIALPRODUCTS 36,796 37,054 +0.7
6. AUTOMOTIVE PRODUCTS 19,215 18,757 -2.4
Glass Anti-Dim Sprays 1,036 889 -14.2
All Other Automotive Products 18,179 17,868 -1.7
7. MISCELLANEOUS 12,708 11,996 -5.6
TOTAL 524,536 517,621 -1.3
Rate of increase (%) 0.5 -1.3
August 2017 Spray 27